Part 3: Analyze Data with a GIS
Step 1 –
Note: This chapter was retired in July 2011. A similar EET chapter that uses the same data and ArcExplorer Java Edition (AEJEE) GIS software is available. See: Investigating Earthquakes with ArcExplorer GIS
Map Earthquake Data Using Latitude and Longitude Coordinates
Map Earthquake Data Using Latitude and Longitude Coordinates
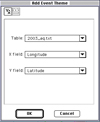
Choose View>Add Event Theme... to map the individual earthquakes of each table (i.e. Sig_Big_eq.txt and Last_year_eq.txt) by latitude and longitude coordinates.


Step 2 – Turn Themes On and Off, Adjust Their Colors, and Rearrange Their Positions to Compare Earthquake Distributions
- When ArcVoyager maps a theme, the program randomly selects a display color. Check to see that the two new point themes (Last_year_eq.txt and Sig_Big_eq.txt) are displayed in contrasting colors. If necessary, change the color of these themes by making the theme active and choosing Theme>Edit Legend.... When the Legend Editor opens, double click the symbol to edit it. Click on the paint brush to access the Color Palette. Once you have selected a new color, be sure to click Apply in the Legend Editor dialog box.
- Turn on the theme containing last year's earthquakes. This theme maps the locations of earthquakes with a magnitude of 4.0 or greater. Click the Open Theme Table
 button to find out how many earthquakes occurred in the past year.
- What do you notice about the distribution of these earthquakes?
button to find out how many earthquakes occurred in the past year.
- What do you notice about the distribution of these earthquakes?
- Turn off last year's earthquakes and turn on the Sig_Big_eq.txt theme. This theme maps "big" earthquakes ranging from the earliest known to the most recent. - How does the distribution of these earthquakes compare to the others?
- Turn these themes on and off to get a sense of how they differ.
- Click and drag the Plate boundaries theme (Bounds.shp), sliding it above the earthquake themes. Take a screen shot to record the patterns you see. - What type of plate boundary is associated with earthquakes with a magnitude of 7.0 or greater?
- Before continuing onto the next step, make sure you have turned off last year's earthquakes along with the plate boundaries theme.


Step 3 – Spatially Query the "Big" Earthquakes to Characterize Their Distribution
As you discovered, most "big" earthquakes are concentrated at convergent plate boundaries. It is possible to characterize a risk zone using a GIS. For example, a spatial query allows us to find out how many magnitude 7.0 or greater earthquakes have occurred within a specified distance of a plate boundary.
- First, set the scale to miles by choosing View >Properties... and selecting decimal degrees as the Map Units and miles as the Distance Units. Click OK.
- Then, select the convergent plate boundaries by querying the plate boundaries theme. Click the Bounds.shp theme once to make it active, but making sure you do not turn the theme on by clicking it's checkbox. Then click the Query Builder
 button. Type the following expression into the input box:( [Margin_typ] = "Convergent" ) and click New Set.
 - Next, turn on the significant earthquake (Sig_Big_eq.txt) theme and make it active by clicking once on its title. Perform a spatial query by choosing Theme>Select by Theme....
- Enter the following information into the menus: Select features of active themes that Are Within a Distance Of the selected features of Bounds.shp. Enter 100 miles as the selection distance.
- Observe the earthquakes on the map that are highlighted in yellow.
- Click the Open Theme Table
button to find out how many earthquakes were selected.
- What percentage of big earthquakes occur within 100 miles of a convergent plate boundary? Within 200 miles?
- Make both the plate boundaries and the significant earthquakes theme active, by holding down the shift key and clicking on their names. Then, click the Clear Selected Features
 button to remove all selections before continuing onto the next step.


Step 4 – Query Earthquake Data and Zoom In and Out to Look for Patterns
- Click once on the title of the Sig_Big_eq.txt theme to make it active. Choose Edit>Copy Themes..., Edit>Paste to duplicate this theme.
- Change the color and or shape of the symbols for both themes so that they contrast.
- Make the top significant and big earthquake theme active and query it to display only the earthquakes that have taken place since 1900. Choose Theme>Properties.... Then, click the Query Builder
button and type the following expression into the input box: ( [Year] >= 1900 ). Click OK.
- Use the Zoom In
 tool and the Zoom Out
  tool to inspect areas where big earthquakes occurred in the past, but where they have not occuured in the last 100 years. Look for areas where a big earthquake may be "overdue." These areas will show up on the map as places where the earthquakes in the last 100 years do not cover up the remaining earthquakes. Look for places where the color of your bottom significant and big earthquake theme is visible.
 - To find out the names of countries as you zoom in, make the countries theme active and then click on a country with the Label
 tool.
tool. - Continue to search for other "overdue" areas by sumbiting another query showing earthquakes that have happened in the last 75 or 50 years.


Step 5 – Label Earthquakes by Date to Analyze Frequencies
One of the ways that Earth scientists try to determine the likelihood of an earthquake striking in the future is by estimating their past frequency of occurence. For example, if there have been four magnitude 7.0 or greater earthquakes in an area in a 200 year period, then this frequency is one in 50 years. Consider how long it has been since the last big Earthquake struck any specific area, as you try to decide where you might expect the next big Earthquake to occur.
- Make the bottom significant and big earthquake theme active set the label field to year. Choose Theme>Properties... and select Text Labels. Set the Label Field to Year. Click OK.
- Use the Zoom In
tool to return to an area you investigated in Step 4. Click on individual earthquakes with the Label
tool to label all the earthquakes in an area by year.
- Select all the earthquakes in the area by clicking and dragging over them with the Select Features tool. Click the Open Theme Table
button to view the records of the earthquakes in the theme. Click once on the Promote button to move the selected records to the top of the list.
- Closely examine the attribute data. Calculate frequencies of occurrence for big earthquakes in various areas on Earth by determining a time interval for earthquake events and counting the number of earthquakes occurring during that interval.
- You may want to turn on last year's earthquake theme to check for recent activity or return to Part 1 to get additional data from the USGS Earthquake Seach site to overlay and compare.
- Take screen shots of any maps you make.


