Smartphones, streams, natural pollution and mineral deposit exploration
Adam C. Simon and Steve Kesler, Department of Earth and Environmental Sciences, University of Michigan
The resources used to make our built environment possible come from many types of mineral deposits. I like to start the conversation about the importance of mineral deposits by showing students a three minute video that unpacks the many resources required to build a smart phone. I find students connect better to the topic of resources when they realize how many of them they use. One of the best videos available is from the American Chemical Society.
Students are amazed that nearly the entire periodic table is necessary just to browse the web or send a text. This is almost always the first time any student realizes the connection of technology to the periodic table.
I then engage the class in a discussion of where all the elements embedded in the fabric of modern society come from. We get them from mineral deposits, which contain anomalously high concentrations of one or more elements such that the element can be extracted profitably. I introduce the concept of mineral exploration and the role geologists play in finding the mineral deposits that are the source of all the elements in their smartphone and everything else we use. Mineral deposits are like needles in a haystack where Earth is the haystack.
I have students do a think-pair-share activity of how they would explore for a new mineral deposit. What clues would they look for? What tools would they use? What might make the presence of a mineral deposit stand out relative to other rocks on Earth's surface?
![[reuse info]](/images/information_16.png)
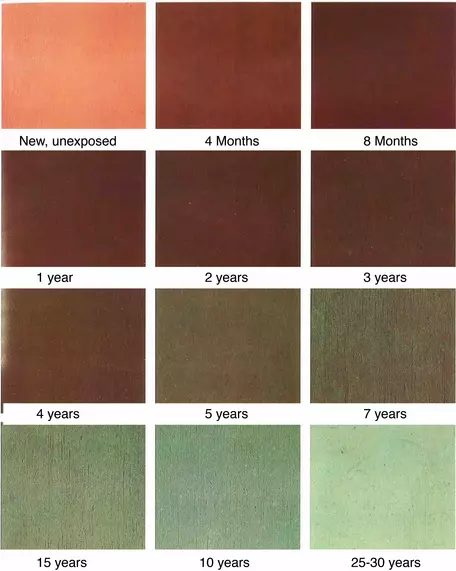
Color changes of copper
4Cu + O2 → 2Cu2O [red to pink]
2Cu2O + O2 → 4CuO [black]
Cu + S → CuS [black]
2CuO + CO2 + H2O → Cu2CO3(OH)2 ["malachite," dark green to blue]
3CuO + 2CO2 + H2O → Cu3(CO3)2(OH)2 ["azurite," blue to purple]
4CuO + SO3 + 3H2O → Cu4SO4(OH)6 ["brochantite," dark green to emerald]
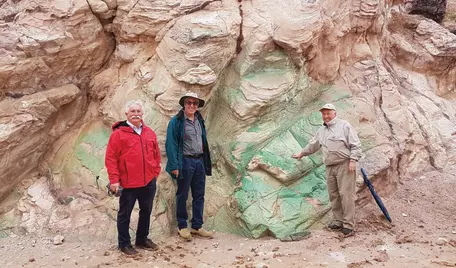
Exploration geologists use lots of tools to discover mineral deposits. In the search for copper deposits, color is one indicator of the needle in the haystack. Imagine walking around the desert or in the jungle and all you see are white, black and grey rocks. And then all of the sudden you see a rock like the one show in Figure 2. That blue-green color immediately tells a geologist that the rock contains a much higher concentration of copper than the average rock on Earth's surface.
I steer students into thinking about how to expand the observation of one green outcrop on Earth's surface into knowledge of the concentration of copper in that geographic area. This is where I introduce the concept of sediment and water sampling as exploration tools. The green color in the outcrop is caused by the same process that causes the green patina of a copper roof. Geologists refer to this as weathering, where reaction of gases in the atmosphere and rain water chemically change rocks at the surface and below the surface. Chemical weathering can produce natural pollution.
Weathering disaggregates, or breaks apart, rocks into clasts that range in size from boulders to ultra-small particles of clay. Weathering also dissolves some minerals and disperses their constituent atoms in solution, first in pore waters in the soil and then in springs that feed water into streams and rivers. Most metals in mineral deposits are in sulfide minerals, which usually dissolve during chemical weathering. For example, the copper mineral chalcopyrite (CuFeS2) will dissolve to produce Cu2+ ions in aqueous solution (i.e., meteoric rain water that flows on the surface or through the subsurface). These dissolved ions often attach to the outer part of the clay-size particles by a process known as adsorption. These clay-sized particles get eroded and become part of the sediment load of streams. During transport, some of the clay particles will settle to the bottom of the stream or laterally along the sides of the stream during periodic flooding. Geologists collect sediment samples from the bottom of a stream and from the sides of the stream and determine the amount of copper present in the fine-grained fraction of the sediments and use these data to detect upstream sources of copper.
In general, metal concentrations in stream sediments are highest at the point in the river that is closest to the actual metal source and decrease downstream until they reach the average or background value (defined in the next paragraph) for that region. This decrease in metal content with distance from the source is caused largely by dilution with other sediment that contain lower concentrations of metal. As water flows down a stream, it erodes more and more sediment. So, any "anomalous," metal-rich sediment that entered the stream will be diluted gradually as the water flows downstream. More abrupt decreases take place at intersections between streams if a stream carrying sediment eroded from a mineral deposit merges with another stream that contains only sediment from rocks containing no mineral deposit. The amount of dilution depends on the relative volumes of sediment in the two streams. If you were trying to locate an unknown source by following analyzed samples upstream and you came to the point where two rivers join, you would probably find that just above the junction one stream would have a high metal content and the other stream a low metal content (Figure 3). The other stream might have a higher metal content above the junction. If so, it would be identified as the stream that was possibly draining an area that contains a mineral deposit (Figure 3).
In order to recognize stream sediment samples that contain unusual or anomalous concentrations of metal, it is necessary to know the concentration of metal in samples that contain material from rocks that lack mineral deposits. This is the content of metal that would be there if the only source of metal for the stream were natural rocks of the region, with no mineral deposits or anthropogenic pollution, and is often referred to as the "background concentration" of the metal of interest. This value will vary depending on the type of rocks in the area and their chemical composition. After several streams in a region have been analyzed, it is possible to estimate a reasonable background value for the stream sediment samples in the area of interest. Knowledge of the background concentration is an important part of both exploration and environmental surveys. Without knowledge of the background, it is not possible to say that a value is anomalous (e.g., higher than normal)....and therefore that it represents either natural or anthropogenic pollution.

If a surveyed region shows little or no variation in metal content across a wide area, then most values are at "background" and there is no near-surface metal source in the region — either anthropogenic or natural — to create anomalous values. However, if some analyses have much higher metal contents than others, a metal source may be present. The search for contaminant sources (whether natural or anthropogenic), then, is a search for anomalies. For example, anomalies in copper values at the surface are a clue that there are rocks beneath the surface with high copper concentrations, and those rocks may be a copper mineral deposit.
If a surveyed region shows little or no variation in metal content across a wide area, then most values are at "background" and there is no near-surface metal source in the region — either anthropogenic or natural — to create anomalous values. However, if some analyses have much higher metal contents than others, a metal source may be present. The search for contaminant sources (whether natural or anthropogenic), then, is a search for anomalies. For example, anomalies in copper values at the surface are a clue that there are rocks beneath the surface with high copper concentrations, and those rocks may be a copper mineral deposit.
What follows is an activity to help students better understand the concept of the discovery of mineral deposits through analysis of surface sediment.
Activity
Examine Figure 3, which is a plan view map of a stream system that discharges into Copper Bay. Remember, water on Earth's surface always flows downhill, and toward a larger body of water such as a bay or ocean, so you should be able to figure out the direction of water flow for each of the streams. If not, raise your hand and ask. Also, remember that streams flow in the lowest points in the valley. Areas between the streams are hills, and you can assume that the highest point on each hill is about midway between the two nearest streams. Please ask for clarification if this is confusing.

Using your knowledge of the general behavior of metals in sediments, answer the following questions about the stream sediment collected from this area.
Questions
1) The values shown in Figure 4 represent the concentrations of copper in the stream sediment samples.a) What is the highest copper concentration obtained in these sediment samples?
The highest concentration is 23 ppm.
b) What is the lowest copper concentration of all the stream sediment samples?
The lowest concentration is 1 ppm.
c) What is the average copper concentration of all the stream sediment samples?
2) Compare the average concentration of copper (from #1c above) to the copper concentrations for the entire area. Is the average value a good estimate of the background copper concentration in stream sediment samples in this area? Why or why not?The average of all concentrations is 4.68 ppm.
The statistical average is higher than the majority of individual stream sediment samples. The values for the stream on the left side of the map are only 1 and 2 ppm. Most of the values for the streams in the center of the map are also 1 and 2 ppm. Thus, the average value is higher than the regional concentration of Cu in sediments.
3) On Figure 4, circle the area(s) that is/are likely to contain a source of copper; that is, a mineral deposit that is undergoing weathering. How did you determine where the mineral deposit is most likely located? Can you tell how far from the river or creek the mineralized area might be (note that the map has a scale in the top left corner)? Explain.
I circled the area where the exploration geologist would focus their effort. The source of the copper should be close to the start of the two streams with sediment that contains 17 and 23 ppm copper.
4) Why are the concentrations of Cu in stream sediments higher in some streams and lower in others? Why is the information useful for an exploration geologist?
The sediment with the highest copper concentrations was transported by streams that drain an area that contains rocks that are anomalously enriched in Cu. This information allows the exploration geologist to focus her effort on a smaller part of this region.
The map in Figure 4 takes only a few minutes to sketch and instructors can draw their own maps and use several, making some more complicated. You can also ask students to draw their own maps and then exchange them to test each other on the concepts introduced in this exercise.
The Debriefing
I always do a debrief after students finish the exercise. I project the maps in Figures 3 and 4 onto the wall (or whiteboard) and then walk through the exercise as a group. We review the concept of concentrations in parts per million and how really small those numbers are. We discuss the concept of determining an average concentration for the entire area and using that to evaluate concentrations that are much higher than average. My goal is to get students to visually see where the most promising areas are for more advanced exploration. I ask students to think-pair-share about what they might do next if they were the exploration geologist in charge of finding an ore deposit in this area. Most groups suggest that they would want to dig into the Earth to see if the high concentrations are just at the surface or if they indicate metal-rich rocks beneath the surface. Depending on the level of the class, you can guide the students into a discussion of using drill rigs to probe the subsurface. There are lots of great videos available if you search for "drilling ore deposit exploration" where the students can gain a tremendous amount of insight into this process. I like to wrap up the exercise by pointing out how seemingly basic these geologic methods are. Students with a keen sense of exploration and love of the outdoors are almost always immediately enamored by the prospect of doing this for a living and my hope is the one or more ultimately make this a career choice.