Teaching about Mineral Consumption and the Environmental Considerations that Accompany It
![[creative commons]](/images/creativecommons_16.png)
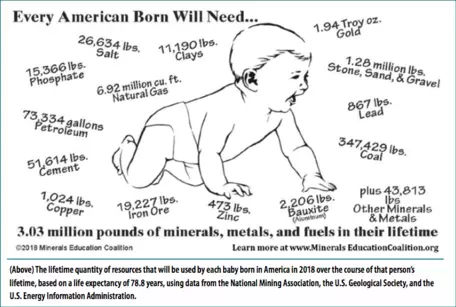
The topic of mineral resources is almost always polarizing. High school and college students bring their own ideas about "mining" to the classroom and rarely think about how their own lives are made possible by mineral resources. Students are even less aware of the orders of magnitude difference between their level of resource consumption compared with the consumption of the vast majority of citizens around the world. Though evaluation of mineral resources is almost always done on a global scale, it is important that students appreciate their own levels of use while gaining insight into the resources necessary to lift up the developing world and how resource consumption will increase with an increasing global population. We like to engage students in a conversation about how mineral resources are related to our everyday lives. The use of mineral resources makes our infrastructure possible: our schools, hospitals, clean water systems and sewer systems, and all forms of transportation.
We scaffold a framework for discussion by allowing students to mine data for their own consumption of a small number of resources. The exercise can easily be adapted for any resource. We focus on five resources: 1) iron ore, used to produce steel that is the backbone of our built environment; 2) salt, used for agriculture and food preservation as well as deicing roads to make travel safer; 3) phosphate, used for agriculture; 4) aluminum, which because of its strength and resistance to corrosion, is used to build airplanes and in construction of buildings and for long-distance electric power lines; and 5) copper, used to push the charge of electrons into everything we plug in and operate by battery.
In this exercise, students extract data about resource production and consumption and use those data to evaluate just how much each person depends on mineral raw materials and therefore how much we, as individuals, contribute to environmental problems related to mineral production. The United States Geological Survey (USGS) tracks the production and consumption of all mineral resources and compiles these data in annual summaries available for free from their Mineral Information home page at: http://minerals.usgs.gov/minerals/pubs/commodity/ Students go to the USGS webpage for the appropriate commodity from Table 1. After opening the Mineral Commodity Summary for that specific commodity, students open the most recent year available. The file will open as a PDF.

Students are told the term "consumption" is defined as the quantity of a resource used by society in one year. The term "production" is the quantity extracted in one year by mining companies from mineral deposits. The term "world reserves" is the quantity of a resource that geologists have verified is available for future extraction. Students should be told that in some cases, the consumption data will be for "apparent consumption," which is defined as the sum of (domestic production plus imports) minus exports. This may be the best estimate available, since production data are not available for all countries. Students use apparent consumption for the exercise if that is reported. It is important to note that in some annual mineral commodity summaries, the data for the most current year may be an estimated quantity. For example, for the 2018 annual summary, U.S. and world production for iron ore is denoted with a superscript "e" as in 2017e . This is because there is a lag time between publication of the summary and final verification of all data. The estimated quantity usually differs little from the final number so we have students use the most current year data even if it is estimated. Students should note the units [e.g., pounds, tons (2000 pounds), tonnes (metric tons, about 2240 pounds), grams, etc.] that are used for each commodity. All comparisons should be in the same units. We provide answers here based on the 2018 Mineral Commodity Summaries, which report data through the end of 2017. We use the estimated data (2017e ) where it is reported. An Excel spreadsheet with the worked answers is available: Simon.print article supplemental_Copy of Mineral-Consumption-Answers.xlsx (Excel 2007 (.xlsx) 19kB Apr15 19)
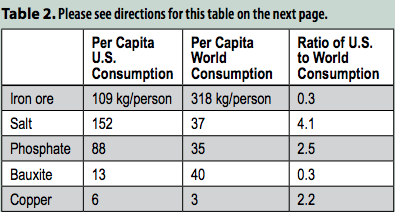
The answers for Table 2 are calculated as follows.
1. For today's population of the U.S., use the following source http://www.census.gov/popclock/. We used a U.S. population of 328,495,642 people obtained on February 26, 2019. Divide total U.S. production numbers from column one in Table 1 by the U.S. population to complete column one in Table 2.
2. For information on world population, use the same census clock http://www.census.gov/popclock/. We used a world population of 7,555,549,095 people obtained on February 26, 2019. Divide total world production numbers from column two in Table 1 by the world population to complete column two in Table 2.
3. Now, calculate the ratio between U.S. per capita consumption and world consumption (that is, column 1 divided by column 2) and put that in the final column in the table above.
To more deeply consider U.S. consumption rates, an important question for students to answer after filling out Table 2 is: What would world production for each of these commodities have to be if the rest of the world were to increase its per capita consumption level to that of the United States?

 The Debriefing
After students work through the exercise, it is important for them to make sense of all the data in Tables 1–5. Students tend to gloss over the units of mass and not think about their own annual use of 109 kg of iron ore or 6 kg of copper. Not worrying about density, we ask the students to think about common objects that have the same mass as the U.S. per capita consumption. We want them to visualize the amount of each resource that is mined to make their built environment possible. We put the students into small groups and have them look up five ways that each of the five resources in the tables are used by society. We specifically tell them to find uses that are not only personal uses. For example, copper and aluminum are used to build the electric grid. Iron ore is used to make steel that is the foundation for buildings and vehicles. This allows the students to develop a connection between themselves and the larger built environment in which they live. We ask students to name products and write them on the chalk board to get the whole class involved. Some products will be on the list of multiple groups, and some will be unique.
Keeping the students in small groups, we ask them to use their data to discuss the following questions.
a. Why is the U.S. per capita consumption for iron ore less than world per capita consumption?
b. What do the data imply for the need for future mining of mineral resources?
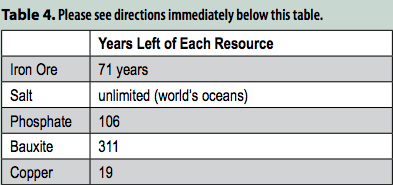
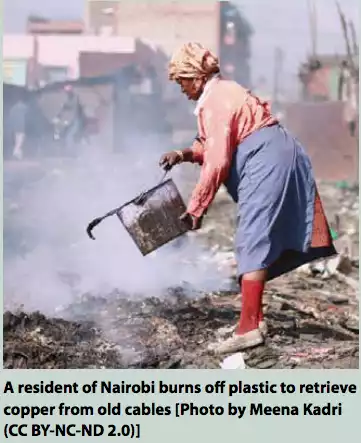
c. What do the data imply for the need to recycle mineral resources already in use around the world?
For question (a), world per capita consumption of iron ore is greater than U.S. per capita consumption because much of the developing world is rapidly increasing their built environment. For the other four resources, world per capita consumption is less than U.S. capita consumption. This tells us that for question (b), world production needs to increase for the developing world to have the same lifestyle as the U.S. Students should use Table 4 to think about question (c). The data in Table 4 tell us that for some resources, especially copper, it will be important to recycle resources that are currently in use. There are lots of resources available online that discuss recycling rates of various resources and we encourage students to seek information on this topic.It is critically important to emphasize to students that they recognize the goal of this exercise is not to make students feel guilty about their personal use of resources. Rather, the goal is for each student to gain an appreciation for the tremendous quantities of resources already in use in the developed world and what new quantities must be found and extracted for the growing population in the developing world.
ONLINE EXTRA: Supplemental Articles and Information
Simon_Mineral_Consumption_Supplement for print article_Student_Version worksheet_ online final.doc (Microsoft Word 161kB Apr15 19)
Simon_Smartphones_Stream-Sediment_final.doc (Microsoft Word 1.4MB Apr15 19)
Simon_Stream-Sediment_Teacher_Copy.doc (Microsoft Word 24.3MB Apr17 19)
Simon_Stream-Sediment_Student_Copy.doc (Microsoft Word 24.3MB Apr17 19)